We released the spring dates for our R live courses! This term, we have chosen to only open two courses: Machine Learning with R and Data Visualization & Dashboard with R. The reason is that they’re our newest classes, and they’ are very current topics in the R community.
Machine Learning with R is our first course this time. It takes place in May 22-23 in Milano Lima.
If you already use R and want to get an overview of machine learning techniques with R, this is the right course for you! You will need some background in theoretical statistics, probability, linear and logistic regression. Actually a basic knowledge in theoretical statistics and probability, is pretty essential, don’t miss it.
You will learn how to group similar observations using Clustering; how to “naturally” aggregate your variables using Dimensionality Reduction; how to predict outcomes using Regression and Classification (LMs, GLMs, Trees, Random forests, Neural networks). In other words, you will get a full-immersion in the Data Mining and the Machine Learning world, using R.
Data Visualization and Dashboard with R is our second course of the spring term. It takes place in June 5-6 also in a location close to Milano Lima.
This course will teach you how to build beautiful, effective and flexible plots using the most modern R tools for data visualization. Then you will discover how to embed visualizations and tables in a powerful Shinyapp, to make your data easily navigable and let their insights emerge.
You should take this course if you have some knowledge of R and would like to deepen your knowledge in data visualization with R, both as static graphs as well as dynamic dashboards.
Some essential information for our first course: Machine Learning with R.
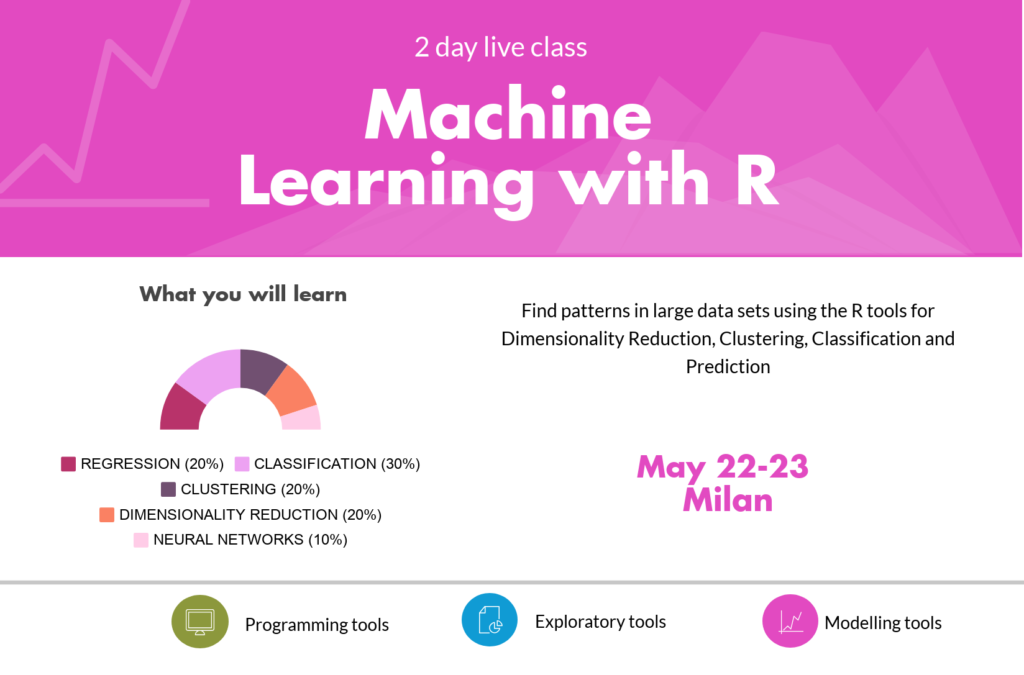
Machine Learning with R Outlines
– Introduction
– Regression techniques
– Classification techniques (LDA, CLASS, KNN)
– Clustering (HC, NHC)
– Dimensionality reduction (MDS, PCA, CA)
– Neural networks
Machine Learning with R is organized by the R training and consulting company Quantide and is taught in Italian, while all the course materials are in English.
The course is for max 6 attendees.
Location
The course location is 550 mt. (7 minutes on walk) from Milano central station and just 77 mt. (1 minute on walk) from Lima subway station.
Registration
If you want to reserve a seat go to: FAQ, detailed program and tickets.
In case you are a group of people interested in more than one class, write us at training[at]quantide[dot]com! We can arrange together a tailor-made course, picking all the topics that are interesting for your organization and dropping the rest.
Other course
Ticket and more info for our second course: Data visualization with R.
