by Quantide | Apr 18, 2018 | Articles, Courses, R blog
We released the spring dates for our R live courses! This term, we have chosen to only open two courses: Machine Learning with R and Data Visualization & Dashboard with R. The reason is that they’re our newest classes, and they’ are very current...

by Quantide | Oct 30, 2017 | Articles, Courses, R blog
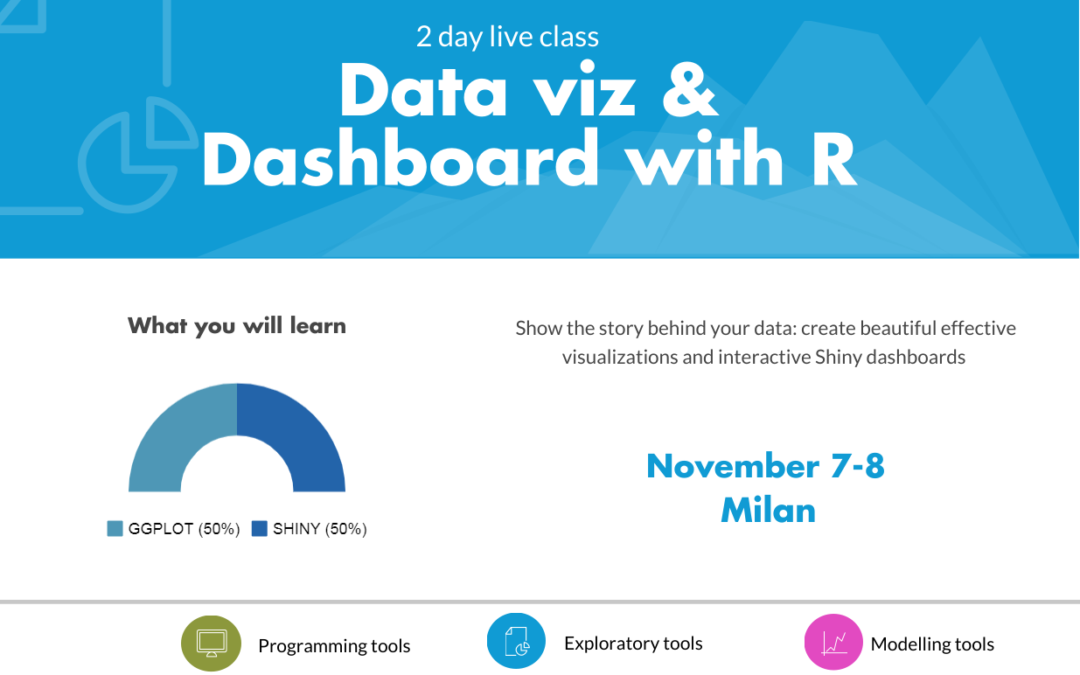
Data Visualization and Dashboard with R is our fourth course of the autumn term. It takes place in November 7-8 in a location close to Milano Lima. This course will teach you how to build beautiful, effective and flexible plots using the most modern R tools for data...
by Nicola Sturaro | Nov 30, 2016 | Articles, R blog
Enrico is a colleague of mine in Quantide. Some days ago, he asked me how to get two different legends for several coloured lines. This is the wanted result: The first version of his plot sounds like the following one: R # Create a Dataframe with Random Data in order...

by Quantide | Nov 22, 2016 | Articles, Courses, News
Hello R Users! We have an awesome news for all of you! Microsoft, in collaboration with Quantide, is offering a one-day live course totally free and open to everybody. Your first date with R course will be on December 13 at Microsoft Innovation Campus in Peschiera...


